
How Do You Identify the Most Profitable Services In a Dental Practice?

By Gretchen Roberts
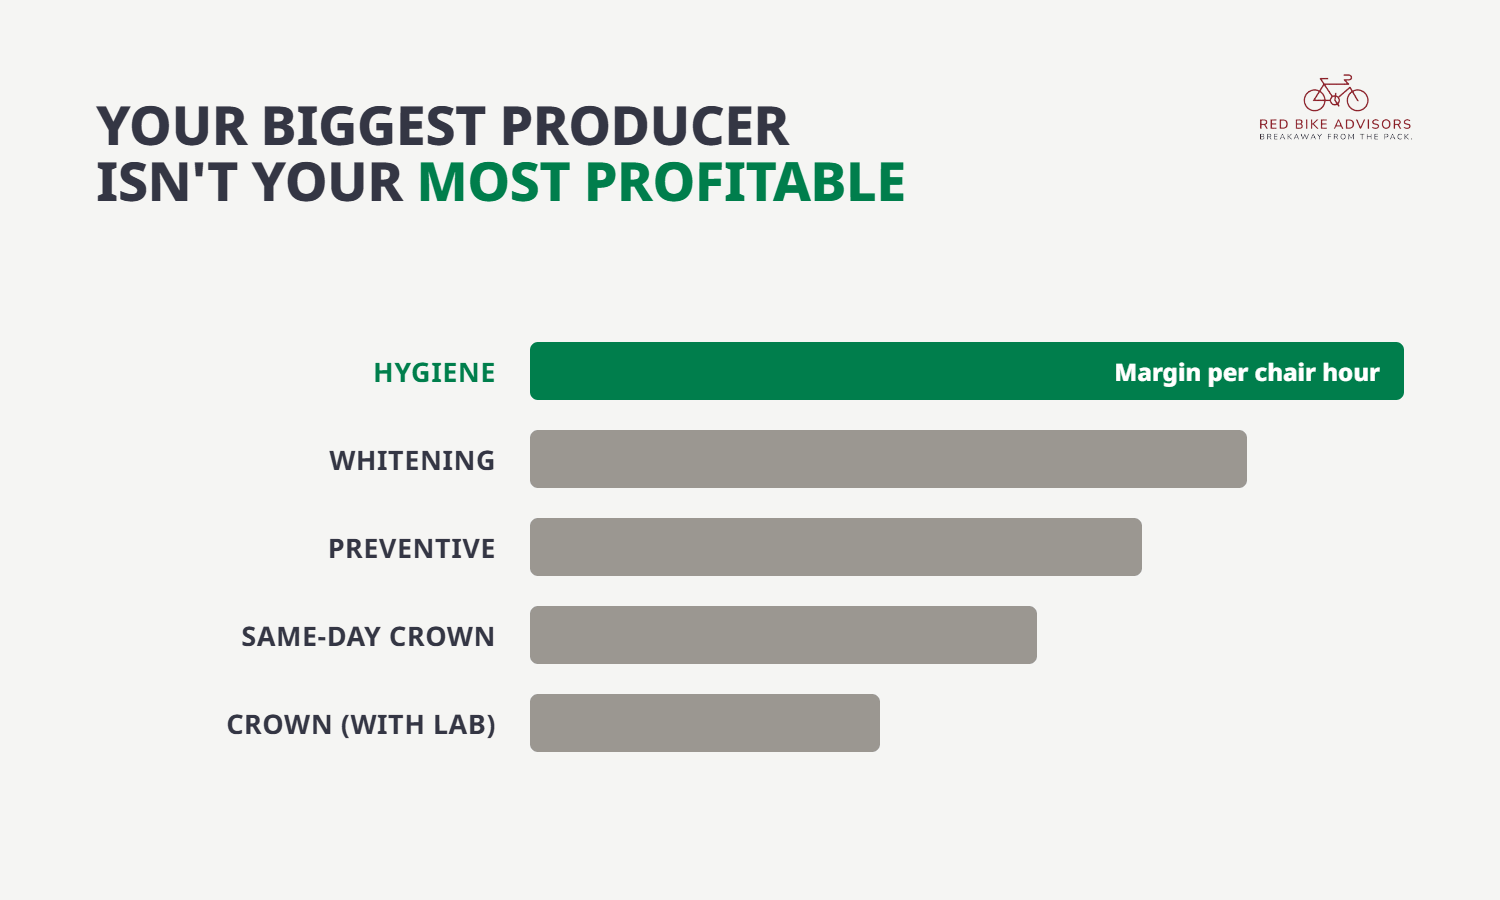
Most dental practices price their services based on insurance fee schedules, regional norms, or what the previous owner charged. Very few price based on actual profitability by procedure. That gap between what you charge and what you actually keep after costs is where profit-powered pricing begins. The most profitable dental services are not always the highest-production procedures. They are the procedures with the best margin after accounting for chair time, lab costs, clinical staff time, and overhead allocation.
Why Production Per Procedure Does Not Tell the Full Story
A crown may generate $1,200 in production but require a lab fee of $150, 90 minutes of chair time, and significant clinical labor. A whitening service may generate $500 in production with minimal lab cost, 45 minutes of chair time, and lower clinical complexity.
On a pure production basis, the crown wins. On a margin and time-efficiency basis, the picture is more nuanced.
The metric that matters for pricing decisions is net margin per clinical hour, not gross production per procedure. Practices that track this number consistently schedule differently, price differently, and hire differently than those that do not.
What Is a Healthy Gross Margin for a Dental Practice?
Benchmark: 87% to 89% gross margin after direct costs (lab fees and supplies), before staff and overhead.
If your lab and supply costs combined are running above 13% of collections, your gross margin is compressed. That compression flows directly to the bottom line. A practice running 17% combined lab and supply costs versus 11% is losing 6 points of gross margin.
On $1.5M in collections, that is $90,000 in margin that is not available to fund overhead, pay the owner, or build wealth.
Which Dental Procedures Typically Have the Highest Profit Margins?
Profitability by procedure varies by practice mix, fee structure, and cost structure. That said, consistent patterns emerge across dental practice benchmarking:
- Hygiene visits: Low lab cost, predictable chair time, high reappointment rate. Hygiene is the financial backbone of most practices when properly priced and fully scheduled.
- Preventive and diagnostic services: Minimal variable cost, strong reimbursement relative to complexity.
- In-house whitening and aesthetic services: Low lab cost, cash-pay or elective, flexible pricing power outside insurance constraints.
- Restorative procedures with in-house lab or CEREC: Practices with same-daycrown capability eliminate the lab fee entirely, dramatically improving margin on restorative work.
- Implants: High production, high lab cost, but strong net margin when the full fee is collected and the clinical time is managed efficiently.
How Do Insurance Fee Schedules Affect Your Pricing Strategy?
If your practice is heavily in-network with PPO plans, your pricing power is constrained.
The PPO fee schedule sets the ceiling for in-network production. This is not a reason to avoid PPOs, but it is a reason to understand the margin implications of your network participation decisions.
A practice that is in-network with four PPO plans at average write-offs of 25% is effectively running at 75 cents on the dollar for insured patients. If the practice also has high lab and supply costs, the margin squeeze on PPO work can be significant.
Some practices strategically limit PPO participation, build fee-for-service volume in their schedule, or focus production efforts on procedures where the PPO write-off is smallest relative to the margin. These are not hypothetical strategies. They are decisions real practices make when they understand their numbers.
What Is the First Step Toward Profit-Powered Pricing?
The first step is a procedure-level cost analysis: map your top 10 procedures by production volume, then assign direct costs to each. What is the average lab fee for that procedure category? What is the average chair time? What is the clinical labor cost associated with that time?
This analysis does not require sophisticated software. It requires your production data, your lab invoices, and a conversation with your advisory team about how to allocate costs accurately.
Most practices that run this analysis for the first time are surprised by what they find. Not all high-production procedures are high-margin. And not all "small" procedures are low-value.
Gretchen Roberts
Gretchen Roberts is CEO of Red Bike Advisors LLC. As a business owner herself, Gretchen has a deep understanding of the problems, questions, and financial pain points that business owners experience on a daily basis, and how strategic financial and tax planning is the key to "breakaway" business growth and success.