
How to Value a Dental Practice: The Financial Metrics That Actually Determine the Number

By Gretchen Roberts
What financial metrics determine the value of a dental practice?
Dental practice valuations are built on five financial metrics: EBITDA margin, collections per year, production per dentist, overhead percentage, and patient base stability. No single metric tells the full story, but each contributes to the final number in a predictable way. A practice that scores well across all five will receive a higher multiple than one that is strong in revenue but weak in profitability. Here is how each metric affects the valuation calculation and what the targets look like.
1. EBITDA and EBITDA Margin
Target for premium valuation: 25% EBITDA margin or above after normalizing owner compensation to fair market value. For a $1.5M practice at 25% EBITDA, that means$375,000 in EBITDA.
Net profit margin and EBITDA are related but different numbers. A single-owner dental practice often shows a higher net profit percentage because the owner's compensation is partly or fully reflected in distributions rather than salary. Buyers normalize this by replacing actual owner compensation with a fair market value associate salary. After that adjustment, the EBITDA is typically lower than the raw net profit suggests.
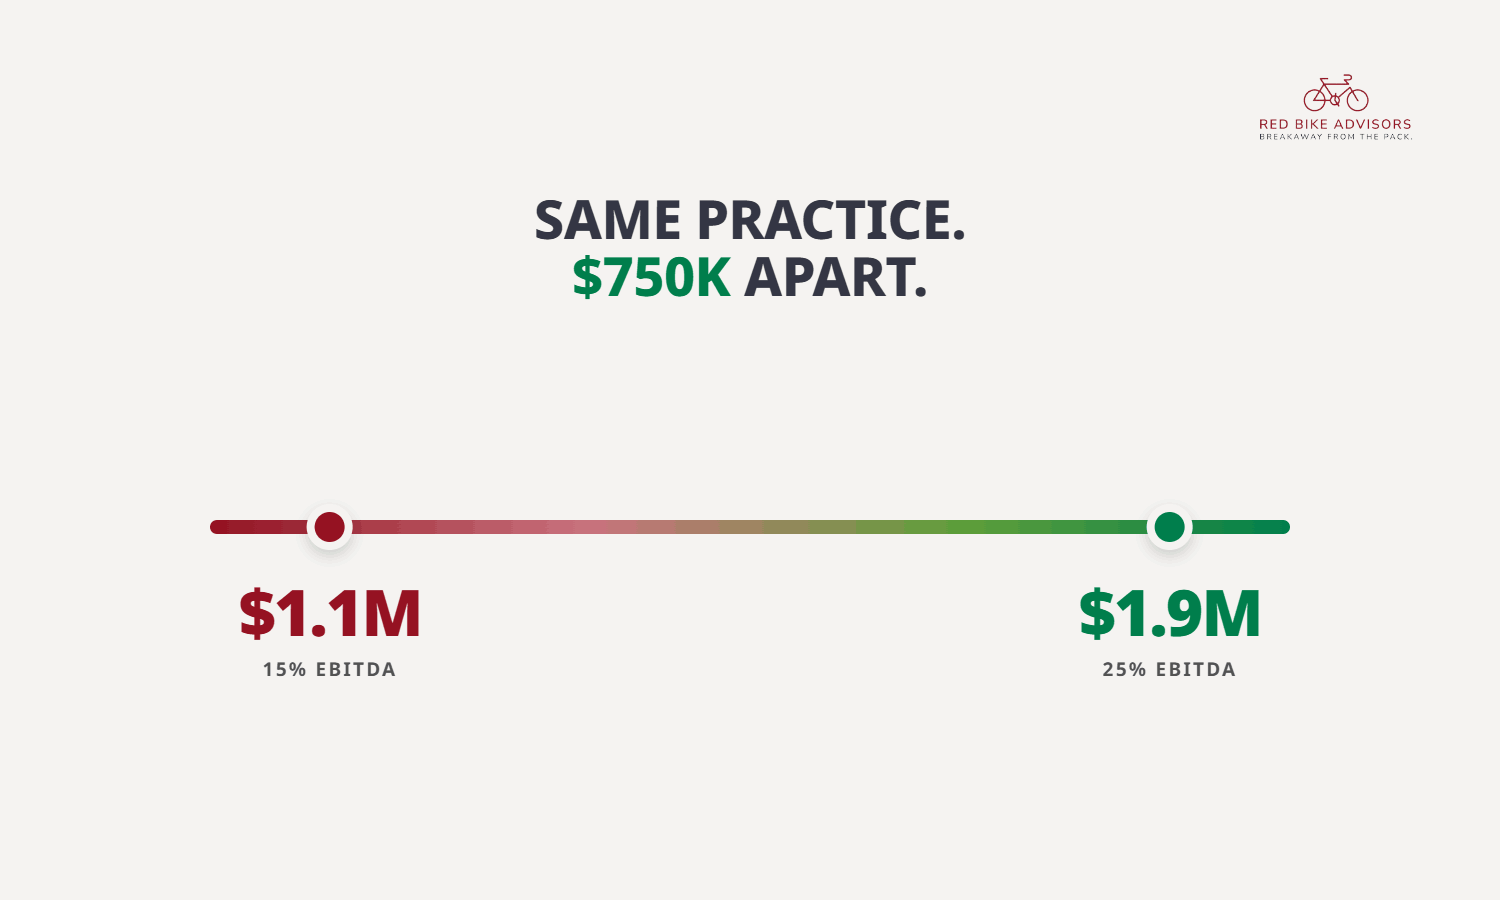
EBITDA is the primary basis for valuation multiples. A practice at 25% EBITDA margin on$1.5M in collections produces $375,000 in EBITDA. At a 5x multiple, that is a $1.875M valuation. The same practice at 15% EBITDA produces $225,000 in EBITDA and a $1.125M valuation at the same multiple. That $750,000 difference in enterprise value comes entirely from overhead control and tax planning, not from adding patients or procedures.
2. Annual Collections and Collections Rate
Target: collections of $1M or more per full-time dentist; collections rate of 96% to 98% of adjusted production
Annual collections is the simplest revenue measure buyers use. It is the actual cash the practice received from patients and insurance, after adjustments and write-offs. The collections-to-production ratio, or collections rate, tells buyers how much of the dentistry performed was actually converted to revenue.
A practice with $1.5M in production but an 87% collection rate has $1.3M in actual collections. The same practice at 97% collection rate has $1.455M in collections. That$155,000 difference in annual revenue compounds over several years and significantly affects the EBITDA calculation.
3. Production Per Dentist
Target: $800,000 or more per full-time equivalent dentist
Production per dentist is a productivity benchmark that tells buyers whether each doctor is being fully utilized and whether the schedule supports the fee structure. A general dentist producing below $600,000 annually raises questions about scheduling efficiency, procedure mix, or time in chair.
This metric also affects buyer projections. A buyer purchasing a practice at $600,000 per dentist production has more upside to optimize than one at $900,000, but the $900,000 practice signals a team and schedule that is already running efficiently.
4. Overhead Percentage
Target: 59% to 63% of collections for total overhead, excluding owner compensation
Overhead percentage is the inverse of EBITDA margin and the most common place where value is either built or destroyed. Staff costs should be 23% to 28% of collections, supplies and lab combined should be 11% to 13%, and facility costs should be 5% to 8%.
A practice where any of these categories runs significantly above benchmark is leaving money on the table every year. And that money, when recovered, flows directly to EBITDA and directly to enterprise value.
5. Patient Base Stability Metrics
Targets: 1,500 or more active patients (prior 18 months); reappointment rate above75%; new patient flow of 15 or more per month per full-time dentist
Buyers model practice revenue using patient base data, not just historical collections. A practice with strong collections but declining new patient flow or poor reappointment rates is a practice whose future revenue is eroding even if the current numbers look good.
New patient trends are particularly important. A practice that has grown new patient acquisition by 15% over three years is a very different story than one that has seen a 15% decline, even if both have similar current collections.
How these metrics interact to determine value
Practice valuation is not a formula applied to a single number. It is an assessment of multiple dimensions that together tell buyers whether the practice is likely to generate similar or growing returns after the seller departs.
A practice with strong EBITDA, high collections per dentist, controlled overhead, and a stable and growing patient base will attract more buyers, receive higher multiples, and close with fewer seller concessions than one that is strong on one or two metrics but weak on the others.
Take the free Practice Profit Audit to see how your practice benchmarks across the five metrics that drive dental practice value: https://redbikeadvisors.com/resources/practice-profit-audit
Gretchen Roberts
Gretchen Roberts is CEO of Red Bike Advisors LLC. As a business owner herself, Gretchen has a deep understanding of the problems, questions, and financial pain points that business owners experience on a daily basis, and how strategic financial and tax planning is the key to "breakaway" business growth and success.