
What Is a Dental Practice Actually Worth? How Profit Drives EBITDA-Based Valuation

By Gretchen Roberts
What determines the value of a dental practice when it sells?
A dental practice is primarily valued on EBITDA (earnings before interest, taxes, depreciation, and amortization) and the multiple a buyer applies to it. For most general dental practices, that multiple ranges from 4x to 6x for independent buyers and 6x to 9x for group or DSO buyers. What drives EBITDA is net profit margin. And what drives net profit margin is how well the practice manages overhead, tax efficiency, and owner compensation. A dental practice at 35% net margin on $1.5M in collections is worth significantly more than one generating identical revenue at 24% margin — and the gap is almost entirely explained by financial discipline, not by clinical production.
What is EBITDA and why do dental practice buyers use it?
EBITDA measures the operating cash flow your practice generates before financing costs, taxes, and non-cash items. Buyers use it because it represents what the practice actually produces as a business, independent of the current owner's specific financial decisions.
Before applying a multiple, buyers normalize EBITDA by adjusting your compensation to a market-rate replacement cost. If you pay yourself $450,000 and a replacement dentist would cost $200,000, the $250,000 above-market compensation is added back to EBITDA. This normalization can dramatically change the picture.
Example: a dental practice with $200,000 in net income but $250,000 in above-market owner compensation has a normalized EBITDA of $450,000. At a 5x multiple, that is a $2.25M valuation, not the $1M a raw net income calculation might suggest.
How does net profit margin translate directly to practice value?
This is the connection most dentists have never seen laid out explicitly. Here is the math:
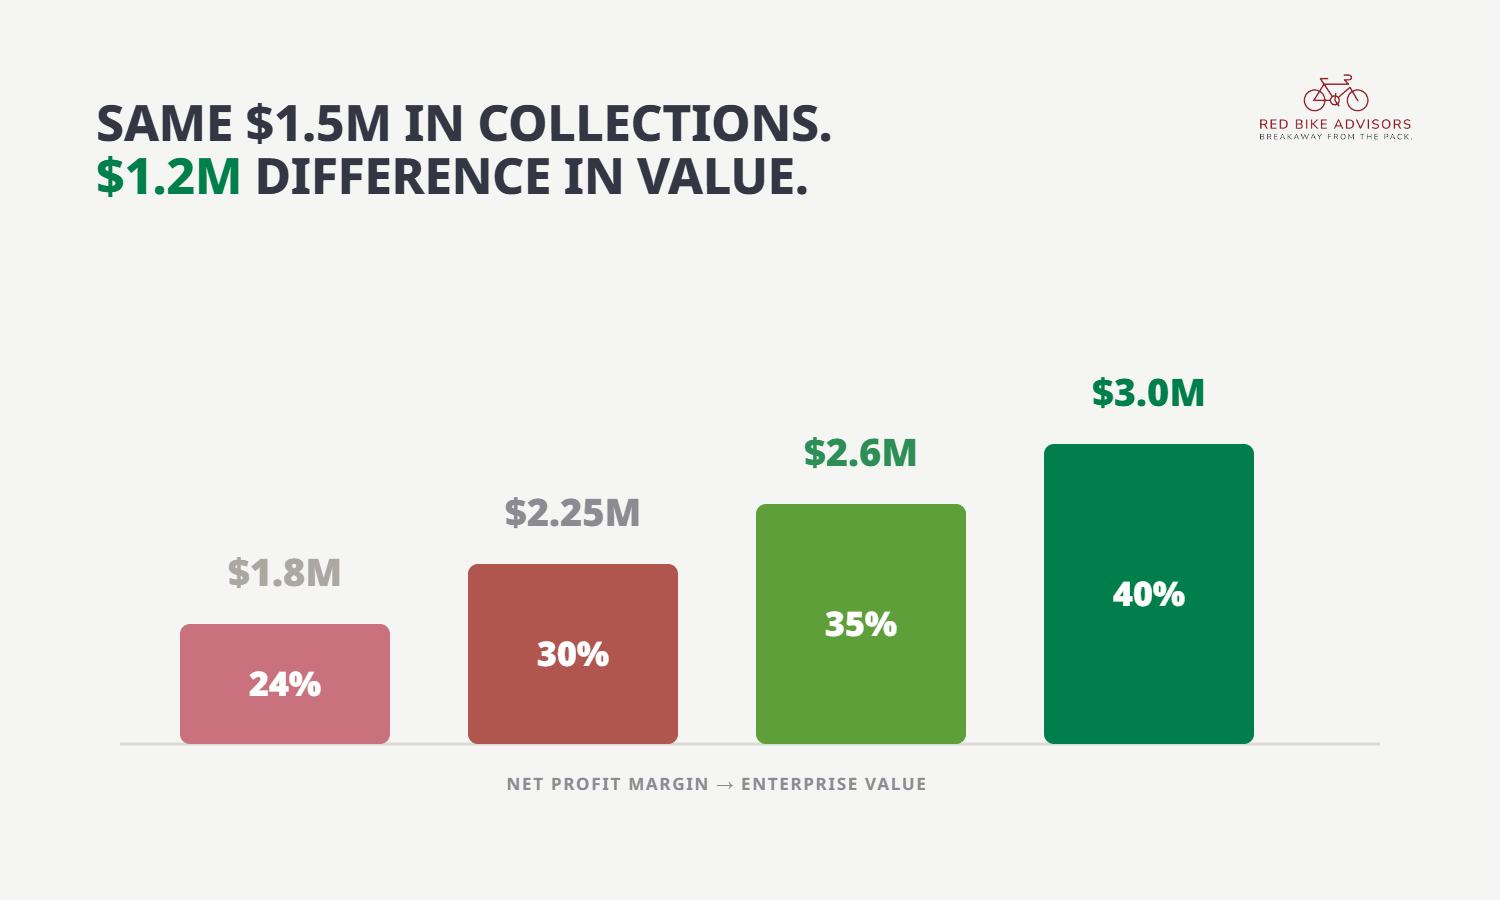
A dental practice generating $1.5M in annual collections:
- At 24% net profit margin: $360,000 EBITDA x 5 = $1.8M valuation
- At 30% net profit margin: $450,000 EBITDA x 5 = $2.25M valuation
- At 35% net profit margin: $525,000 EBITDA x 5 = $2.625M valuation
- At 40% net profit margin: $600,000 EBITDA x 5 = $3.0M valuation
Each 5-point improvement in net profit margin adds approximately $375,000 in enterprise value at a 5x multiple on a $1.5M practice.
That is not growth. That is optimization. The same patients, the same clinical production, and meaningfully more enterprise value.
What drives net profit margin in a dental practice?
Net profit margin is the result of four controllable variables: overhead costs, tax efficiency, compensation structure, and wealth building strategy. Each one affects how much of the practice's gross revenue becomes actual profit.
Overhead costs. Staff costs, lab and supply costs, and operating expenses that run above industry benchmarks directly compress margin. A practice running staff costs at 34% of collections versus the 28% benchmark is losing 6 points of margin before any other variable is considered. On a $1.5M practice, that is $90,000 in annual profit that does not exist.
Tax efficiency. A practice that is not structured as an S-Corp when it should be, or that has not established a retirement plan, is paying taxes on income that could otherwise be deferred or eliminated. These are not marginal improvements. A properly structured 401(k) with spousal contributions can shelter $47,000 or more per year from taxable income. An S-Corp salary optimization can reduce payroll taxes by $15,000 to $25,000 annually. Both flow directly to net profit.
Compensation structure. How you pay yourself as the practice owner determines your practice's normalized EBITDA and therefore its valuation. A salary set once when the practice opened and never reviewed is almost certainly costing you on either the tax side (if too low) or the payroll tax side (if too high). The right structure requires an annual review.
Wealth building velocity. Practices where the owner is building personal wealth outside the practice, through tax-advantaged retirement accounts, real estate, or structured investment, are creating leverage that compounds alongside the practice's equity. Practices where all wealth is tied up in the practice itself are concentrating risk in a single illiquid asset
What is the difference between a practice worth $1.8M and one worth $2.6M?
At the same $1.5M in collections, the $800,000 difference in valuation in the examples above comes entirely from the 11-point difference in net profit margin.
That margin gap typically traces to three or four specific factors: staff costs running above benchmark, a retirement plan that was never optimized, an S-Corp compensation structure that was set once and never reviewed, and a tax plan that files what happened rather than planning what should happen.
None of these require growing the practice. They require getting the financial infrastructure right.
How do you know where your practice stands on these metrics?
Most practice owners have never seen their net profit margin benchmarked against other dental practices at their revenue level. They do not know whether their overhead is in range, whether their retirement vehicle is the right one, or whether their compensation structure is costing them in payroll taxes.
That is exactly what the Practice Profit Audit is designed to surface. It takes about 3 minutes, covers tax efficiency, retirement optimization, practice profitability, and wealth building velocity, and gives you a personalized estimate of what you may be leaving on the table each year.
Before you can build toward a higher valuation, you need to know where the leaks are.
Take the free Practice Profit Audit to see how your net profit, tax structure, and retirement plan compare to benchmarks for practices at your revenue level: https://redbikeadvisors.com/resources/practice-profit-audit
Gretchen Roberts
Gretchen Roberts is CEO of Red Bike Advisors LLC. As a business owner herself, Gretchen has a deep understanding of the problems, questions, and financial pain points that business owners experience on a daily basis, and how strategic financial and tax planning is the key to "breakaway" business growth and success.