
What Is a Normal Overhead Percentage for a Chiropractic Practice?

By Gretchen Roberts
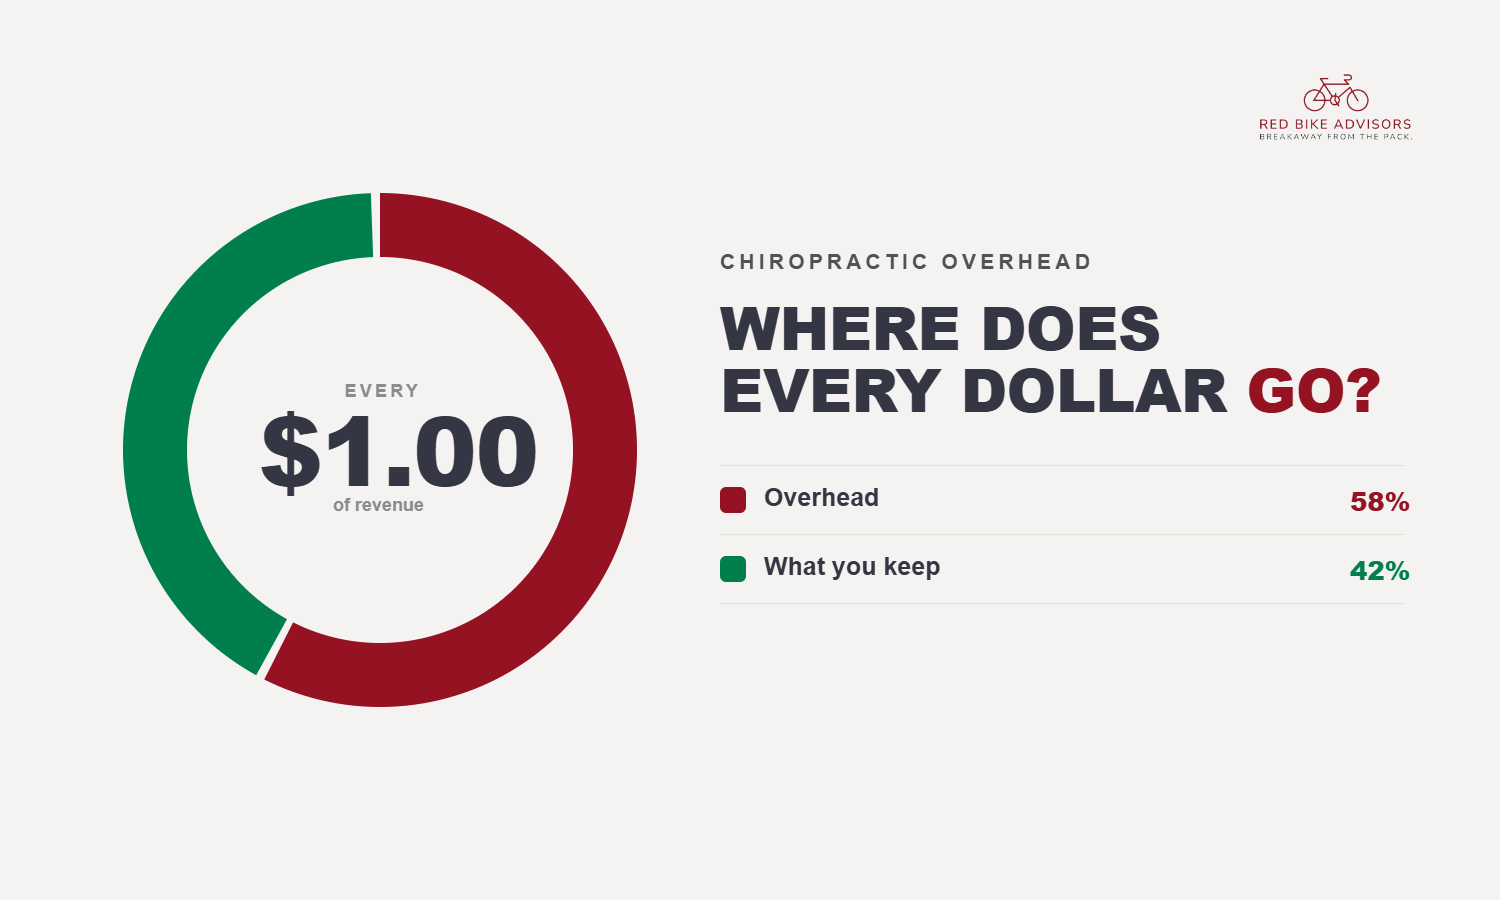
A healthy chiropractic practice runs total overhead at or below 50 percent of revenue. Topperforming practices get that number under 44 percent. If your practice is running at 58 or 60 percent, you are working full schedules and keeping a fraction of what you earn.
Key Benchmarks for Chiropractic Practices
| KPI | Healthy Range | Top Performers |
|---|---|---|
| Net Profit Margin | 30–40% | 40–55% |
| Collections Ratio | 95% or above | 97–99% |
| Staff Cost | 18–28% of revenue | Under 22% |
| Total Overhead | Under 50% | Under 44% |
| Avg Revenue Per Visit (cash) | $120–$200 | $180–$250+ |
| Avg Revenue Per Visit (insurance) | $60–$90 | $85–$100 |
| Cash Runway | 3–6 months opex | 6+ months |
Average revenue per visit is the metric most unique to chiropractic. A cash-pay practice at $110 per visit when top performers are hitting $180 is leaving $420,000 on the table at 6,000 annual visits. Not from adding patients. From pricing and service structure.
Want to see where your Chiropractic practice stands?
We built a free five-minute assessment that scores your practice across all 8 KPIs and shows you your biggest opportunities. You can take it at the link below:
https://redbikeadvisors.com/resources/chiropractic-practice-assessment
Gretchen Roberts
Gretchen Roberts is CEO of Red Bike Advisors LLC. As a business owner herself, Gretchen has a deep understanding of the problems, questions, and financial pain points that business owners experience on a daily basis, and how strategic financial and tax planning is the key to "breakaway" business growth and success.