
What KPIs Should I Track Monthly to Improve Profit?

By Gretchen Roberts
If you’ve ever asked yourself what numbers you should be looking at each month, you’re not alone.
Most business owners are already tracking something: revenue, bank balance, and maybe expenses.
But even with all of that, profit still feels unpredictable.
That’s where the confusion comes in.
The issue isn’t a lack of data. It’s that the numbers being tracked aren’t giving clear direction, or worse, they’re leading to the wrong conclusions.
The Real Problem with KPIs
Most businesses don’t have a KPI problem.
They have a clarity problem.
We see it all the time:
- Financials are messy or inconsistent
- Costs aren’t categorized correctly
- Job-level data doesn’t tie back to the P&L
When that happens, the numbers exist, but they don’t tell a clear story.
Instead of showing where profit is being created or lost, they create noise.
Decisions become reactive. Profit feels unpredictable.
The starting point isn’t adding more metrics. It’s getting the structure right, so the numbers actually reflect how the business operates.
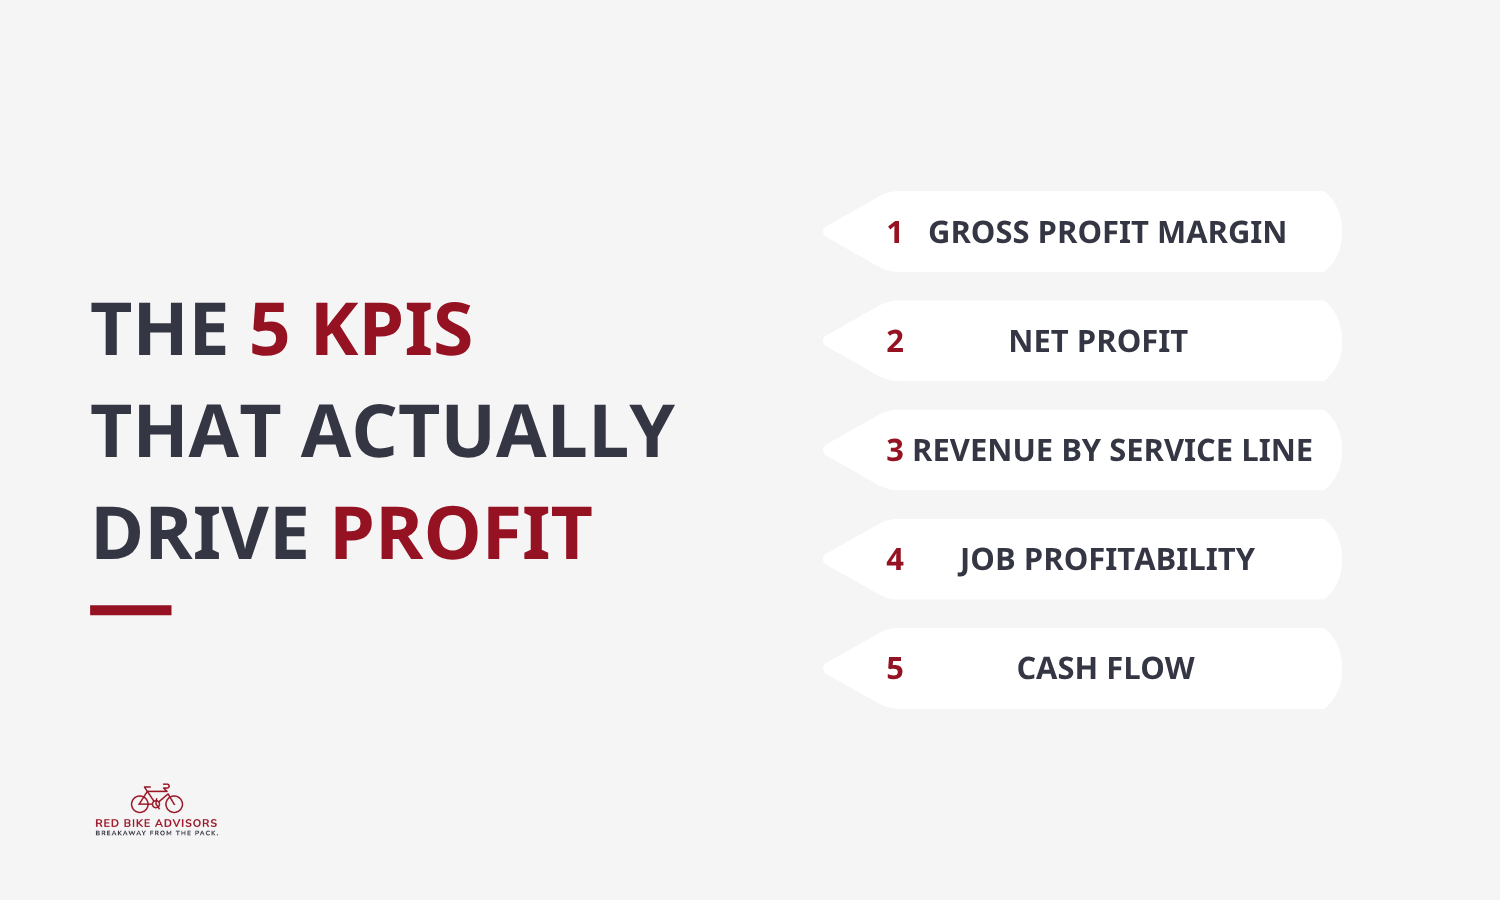
The 5 KPIs That Actually Drive Profit
If you’re trying to improve profitability, these are the numbers that matter most.
1. Gross Profit Margin
This is the foundation.
If this number is off, everything else is built on bad data.
Gross profit tells you:
- Are your jobs actually profitable?
- Are your labor and materials priced correctly?
- Is your cost structure sustainable?
But here’s the catch:
If your costs aren’t classified correctly, your gross margin is meaningless.
We often see things like:
- Labor to deliver the product or service sitting in overhead instead of cost of goods
- Vehicle expenses miscategorized
- Materials dumped into operating expenses
When that happens, your margin looks better (or worse) than it really is.
And you start making decisions based on bad information.
Make sure everything that should be in Cost of Goods is in the right spot so you can see true gross profit margin and compare it to the industry.
2. Net Profit (Operating Income)
This is what’s actually left after running the business.
It answers:
- Is the business generating real profit?
- Can you afford to reinvest, hire, or scale?
- Are you building something sustainable, or just staying busy?
A business can have strong revenue and still struggle here.
Because growth without margin control doesn’t create profit. It's an indicator that something is off in your Cost of Goods, Operating Expenses, or Sales & Marketing.
3. Revenue by Service Line (or Project Type)
Not all revenue is equal.
If everything is lumped into one bucket, you can’t see:
- Which services are most profitable
- Which jobs are dragging margins down
- Where to focus your growth
For example:
- Design vs. Installation (landscaping)
- Maintenance vs. project work (service trades)
- Implants vs. Hygiene (dental)
- Cash vs. Insurance (chiropractic)
- Procedures vs. routine visits (medical)
- Surgeries vs. routine vaccinations (veterinary)
- When you break this out, patterns start to emerge.
And those patterns drive better decisions.
4. Job or Project Profitability
This is where things usually break down.
A business might be profitable overall but losing money on specific jobs without realizing it.
Tracking job profitability helps you understand:
- Whether a job actually made money
- Where you went over budget
- Whether your pricing is accurate
Without this, you’re guessing.
With it, you’re improving every project moving forward.
5. Cash Flow (and Timing)
Profit doesn’t mean much if cash isn’t there when you need it.
You need to understand:
- When cash is coming in (and if it’s coming in fast enough)
- When it’s going out
- Whether your timing creates pressure
- Whether you have enough cash in the bank to cover seasonality or slow months
We often see businesses:
- Paying for labor and materials before collecting from clients
- Billing too late and/or not operationalizing a regular follow-up cadence
- Billing on generous terms
The goal is to have cash coming in before, or at least at the same time you’re paying your team.
That’s how you maintain stability as you grow.
What This Looks Like in Practice
We worked with a business owner who was trying to understand why profit felt inconsistent.
Revenue looked strong. Work was steady.
But:
- Costs were scattered across the chart of accounts
- Labor wasn’t clearly split between field and admin
- Job-level visibility didn’t exist
So every month, the numbers told a different story.
Once we cleaned up the structure:
- Costs moved into the right categories
- Gross margin became accurate
- Job profitability became visible
And suddenly, decisions got easier, not because the business changed overnight, but because the visibility did.
The Bottom Line
If you’re trying to improve profit, don’t start with more dashboards.
Start with better clarity.
The right KPIs aren’t complicated:
- Gross profit
- Net profit
- Revenue breakdown
- Job profitability
- Cash flow
But they only work if the data behind them is clean and structured correctly.
Because at the end of the day: Better decisions don’t come from more numbers. They come from the right ones.
Gretchen Roberts
Gretchen Roberts is CEO of Red Bike Advisors LLC. As a business owner herself, Gretchen has a deep understanding of the problems, questions, and financial pain points that business owners experience on a daily basis, and how strategic financial and tax planning is the key to "breakaway" business growth and success.