
How Do You Read a Dental Practice Profit and Loss Statement?

By Gretchen Roberts
A dental practice P&L tells you one thing: did your practice make money over a specific period, and where did that money come from and go?
You do not need an accounting degree. You need to know the five lines that actually matter.
A P&L, or income statement, has two sides: revenue coming in and expenses going out.
What is left after expenses is your net profit.
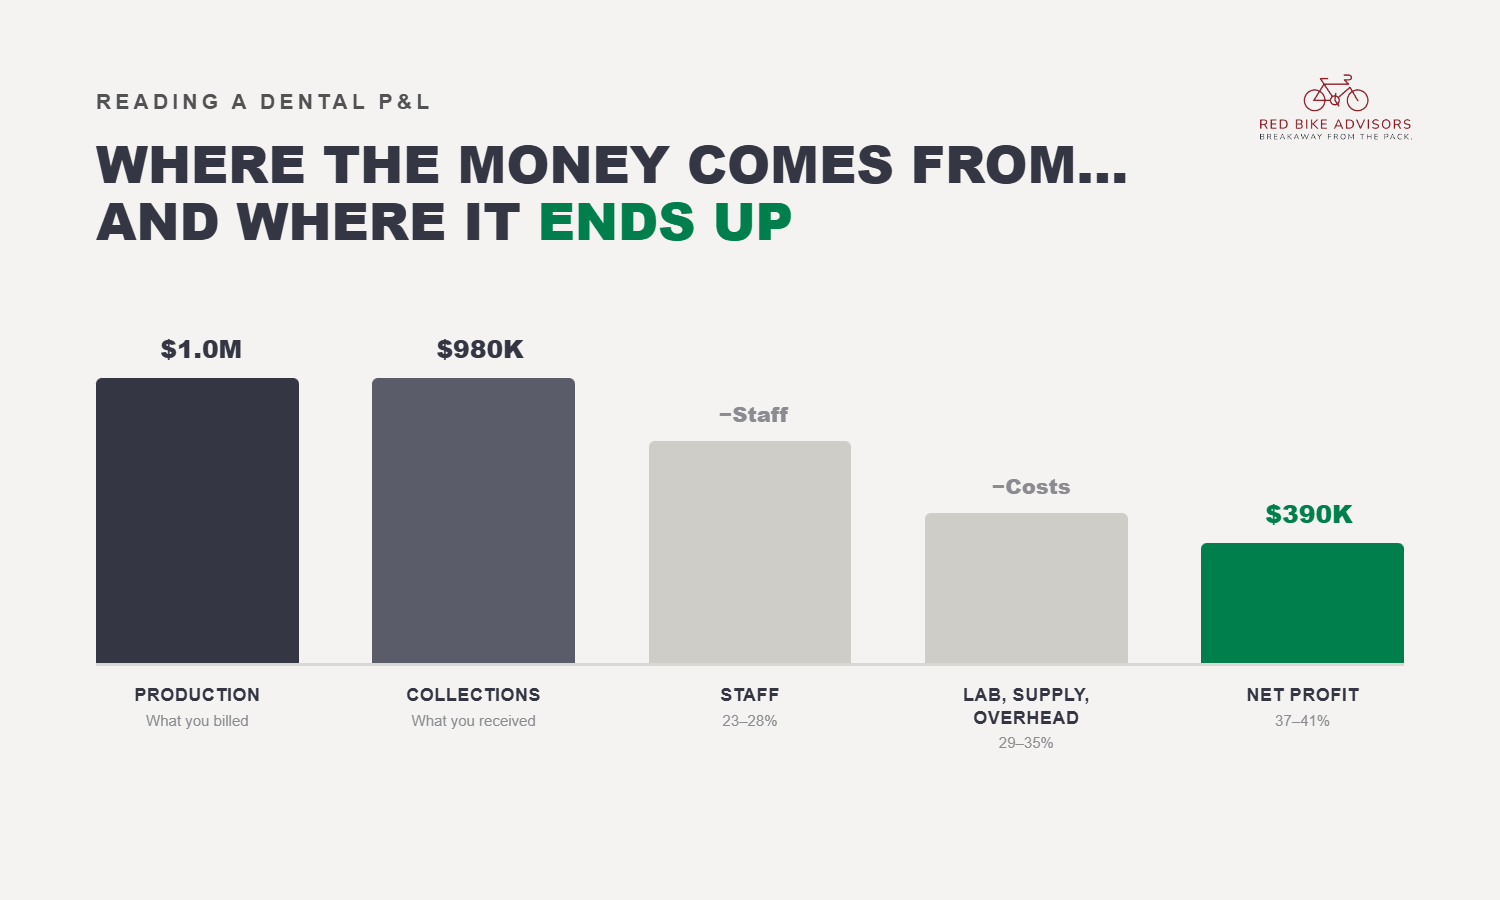
For a dental practice, revenue starts with production, which is what you billed. It then adjusts down to collections, which is what you actually received after insurance write-offs and patient payments. Net profit is what remains after all practice expenses, before you pay yourself an owner salary.
Most practice owners look at their P&L once a year, right before taxes. That is the single most expensive habit in dental practice ownership.
What Is the Difference Between Production and Collections in a Dental P&L?
Production is what you billed. Collections is what you actually received. These are not the same number.
A healthy practice runs a collections ratio of 98 percent or higher. Top performers hit 99 percent. If your P&L shows collections significantly below adjusted production, you have a revenue cycle problem. That gap is money you earned but did not receive.
Improving your collections ratio from 92 percent to 97 percent generates $50,000 in additional revenue for a $1 million practice. Fixing those two problems would add $180,000 to annual revenue, without a single new patient!
How Do You Read the Expense Categories on a Dental P&L?
Each major expense category has a benchmark range. When a category exceeds its benchmark, it does not just affect that line. It compresses your net profit directly.
| Category | Benchmark | Warning Sign |
|---|---|---|
| Staff Salaries & Benefits | 23–28% of collections | Above 28% costs $10K/pt above benchmark on $1M revenue |
| Lab Fees & Dental Supplies | 11–13% combined | Above 13% erodes net profit directly |
| Overhead (rent, tech, subs | 18–22% | Above 22%; creeps slowly but compounds |
| Net Profit (before owner salary) | 37–41% | Below 30% means working hard for too little |
These four categories, read together, tell you almost everything you need to know about practice health.
What Is a Good Net Profit Margin for a Dental Practice?
Net profit before owner compensation should run between 37 and 41 percent of collections. Top performers hit 41 percent and above.
A practice doing $1 million in revenue at 25 percent net profit keeps $250,000. The same practice at 40 percent keeps $400,000. That is $150,000 more per year, in the same building, with the same patients, doing the same work.
If net profit is below 30 percent, something in the expense structure is out of alignment. It is almost always one of the three categories above it on the P&L.
Why Does Reviewing Your P&L Monthly Change the Numbers?
I was talking to a practice owner last month who had been reviewing her P&L annually, right before taxes. When we started reviewing it monthly, we caught staffing cost that had climbed from 26 percent to 31 percent over eight months.
Six weeks of schedule adjustments recovered about $40,000 in annualized net profit.
The problem was not complicated. It was invisible, because no one was looking at the right numbers at the right frequency. Monthly P&L review does not require more work. It requires looking at the right lines and knowing what they should say.
How Do You Start Benchmarking Your Dental Practice P&L?
The first step is pulling your numbers and comparing them against these benchmarks by category. Most practice owners have a general sense of how the practice is performing.
What they rarely have is a precise picture of which category is creating the gap.
Want to see how your practice compares against dental-specific benchmarks? Take our Dental Practice KPI Benchmark assessment https://redbikeadvisors.com/resources/dental-practice-assessment
Gretchen Roberts
Gretchen Roberts is CEO of Red Bike Advisors LLC. As a business owner herself, Gretchen has a deep understanding of the problems, questions, and financial pain points that business owners experience on a daily basis, and how strategic financial and tax planning is the key to "breakaway" business growth and success.