
Is Your Dental Practice Leaving Money on the Table?

By Gretchen Roberts
I was talking to a chiropractor who had just crossed $1.2 million in revenue.
He was proud of that number. And he should be. That is real growth.
But when we started going through his financials, something interesting happened.
He got quiet.
His collections ratio was sitting at 91%. His staff cost was over 32% of revenue. His net profit was 26%.
He was doing $1.2 million in revenue and keeping far less than he should have been. Not because business was bad. Because no one had ever handed him a scorecard.
That is the problem I see most often with practice owners.
They are excellent clinicians. They are working hard. But they are flying the plane without instruments.
So let me give you the instruments.
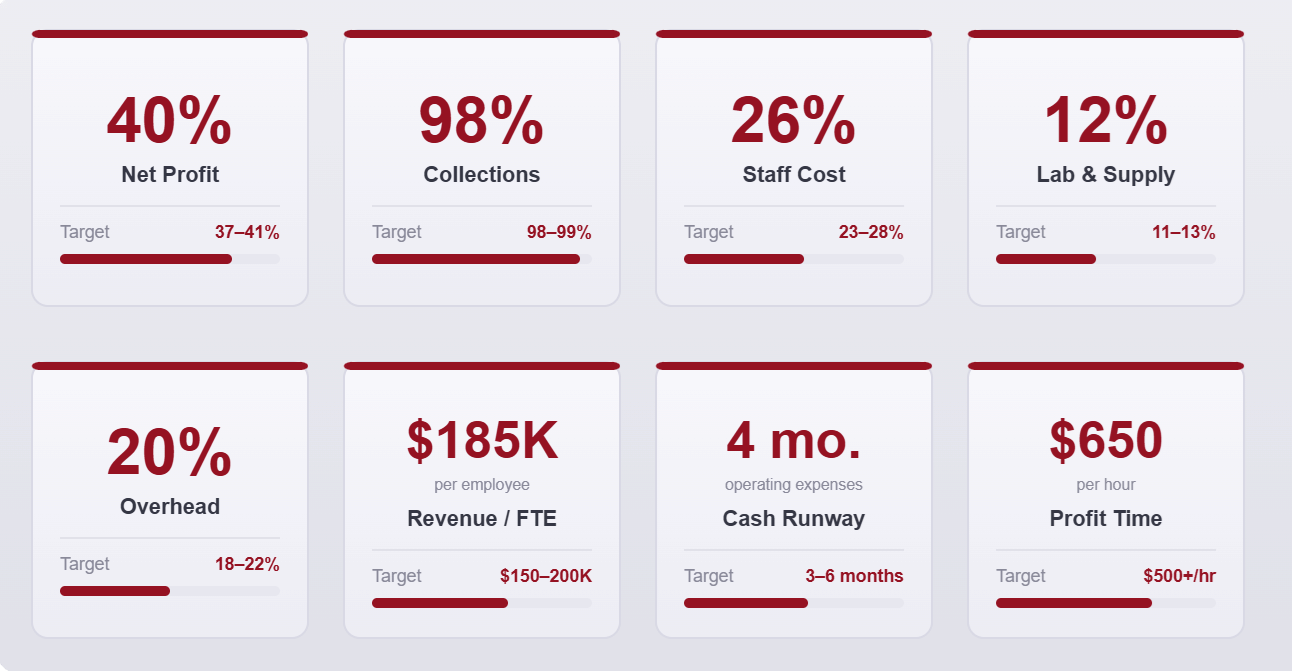
The 8 Financial KPIs Every Practice Should Track Monthly
These benchmarks apply broadly across dental, medical, chiropractic, physical therapy, and veterinary practices. Some numbers vary slightly by specialty, but the framework is the same. These are the metrics that separate practices that build wealth from practices that break even.
1. Net Profit Margin
Benchmark: 37-41% is healthy. Top performers hit 41% and above.
This is the single most important number in your practice. It tells you what you actually keep after expenses, before you pay yourself a salary.
Most practice owners I talk to are somewhere between 25% and 32%.
That gap is not abstract. A practice doing $1M in revenue at 25% net profit keeps $250,000.
The same practice at 40% net profit keeps $400,000. Same building. Same patients. Same hours. The only difference is the financial structure underneath it.
If you are below 30%, there is something in your expense mix that needs attention before anything else.
2. Collections Ratio
Benchmark: 98% or higher. Top performers hit 99%.
This is the percentage of your adjusted production that you are actually collecting.
Most practice owners do not know this number off the top of their heads. And most are quietly losing $30,000 to $75,000 a year through the gap between what they produce and what they collect.
Here is why this matters: Improving your collections ratio from 92% to 97% generates $50,000 in additional revenue for a $1M practice. That is the equivalent of 200 to 250 new patients every year.
Without a single new patient.
It is not a marketing problem. It is a billing and collections system problem.
3. Staff Cost as a Percentage of Revenue
Benchmark: 23-28% of revenue.
Staff is the largest controllable expense in most practices. And it has a tendency to creep.
You add a part-time front desk person during a busy stretch. You give raises that are not tied to production benchmarks. A team member's role evolves but their hours and compensation do not get reassessed.
Every point above 28% costs a $1M practice $10,000 in net profit. Three points over benchmark is $30,000 gone before you see it.
Under 23% is worth looking at too. That may signal your team is stretched, and stretched teams create patient experience problems that eventually show up in your revenue.
4. Lab and Supply Cost
Benchmark: 11-13% combined.
These are your most directly controllable costs. Vendor pricing, supply purchasing habits, and lab relationships all live here.
A practice at 17% lab and supply cost versus 13% is losing $40,000 per year at a $1M revenue level. That is a fully funded retirement contribution and a family vacation. Most practices skip the renegotiation because it feels uncomfortable. But it is one of the fastest financial wins available.
5. Overhead and Operating Expenses
Benchmark: 18-22% of revenue.
This covers rent, software subscriptions, equipment maintenance, utilities, professional services, and everything else that is not staff, labs, or supplies.
Overhead rarely feels urgent. That is exactly what makes it dangerous.
A practice at 27% overhead versus 21% is losing $60,000 a year in net profit. That is the difference between a practice that builds real wealth and one that breaks even year after year.
The fix is usually not dramatic. It is a quarterly review of subscriptions, a lease renegotiation, or a hard look at which services are genuinely earning their cost.
6. Revenue per Full-Time Equivalent Employee
Benchmark: $150,000 to $200,000. Top performers exceed $250,000.
This is a team efficiency metric. Divide your total revenue by the number of full-time equivalent employees, counting yourself if you work clinically and part-timers as 0.5.
Low revenue per employee means the practice is either overstaffed, underproducing, or both.
Top-performing practices generate over $250,000 per team member. If yours is at $120,000, you are not getting the return on your largest expense. And without tracking this number, you may not even know where the gap is.
7. Cash Runway
Benchmark: 3-6 months of operating expenses in a liquid account.
This one is less about profitability and more about resilience.
82% of small businesses fail due to cash flow problems. Not profitability problems. Cash problems.
A practice can be busy. Patients are coming in. Production is up. And it still cannot make payroll if the cash is not managed separately from income. That is not a revenue problem. That is a cash management problem.
Practices with less than one month of cash runway are making fear-based decisions. Practices with three to six months make strategic ones. The difference in outcomes is significant.
8. Profit Time Index
Benchmark: $500 per hour minimum. Exceptional practices hit $1,000 per hour or more.
This is the one that tends to stop practice owners cold.
Take your annual net profit. Divide it by the number of hours you personally work in the practice each year. That number is your hourly return on your role as the owner.
You take all the risk. You carry the weight. You are not an associate.
You should be earning more per hour than anyone else in the building. If that is not true right now, it is not a time problem. It is a leverage problem.
What To Do With This Information
Most practice owners are shocked by at least two of these numbers when they run them for the first time.
Not because they are bad operators. Because no one ever handed them a benchmark sheet.
The problem I see most often is not that practices are performing badly. It is that they are performing without a scorecard. And without a scorecard, you cannot know which lever to pull first.
Pull your numbers for the last 12 months. Work through each of these eight metrics. See where you land. The categories where you are below benchmark are not failures. They are opportunities with dollar signs attached.
Collections ratio at 91%? That is a recoverable $70,000 at $1M revenue.
Staff cost at 31%? That is $30,000 in recaptured net profit if you bring it to 28%.
Overhead at 26%? There is likely $40,000 to $60,000 sitting in expenses that are not earning their cost.
The practices that build real wealth are not the ones with the most patients. They are the ones that know their numbers.
If you want to know where your practice actually stands against these benchmarks, we built a free five-minute assessment that scores your practice across all 8 KPIs and shows you your biggest opportunities.
You can take it at the link below
Gretchen Roberts
Gretchen Roberts is CEO of Red Bike Advisors LLC. As a business owner herself, Gretchen has a deep understanding of the problems, questions, and financial pain points that business owners experience on a daily basis, and how strategic financial and tax planning is the key to "breakaway" business growth and success.