
Physical Therapy Practice Financial Benchmarks: What the Numbers Should Look Like at $500K to $2M

By Gretchen Roberts
What are the financial benchmarks for a physical therapy practice at $500K to $2M in revenue?
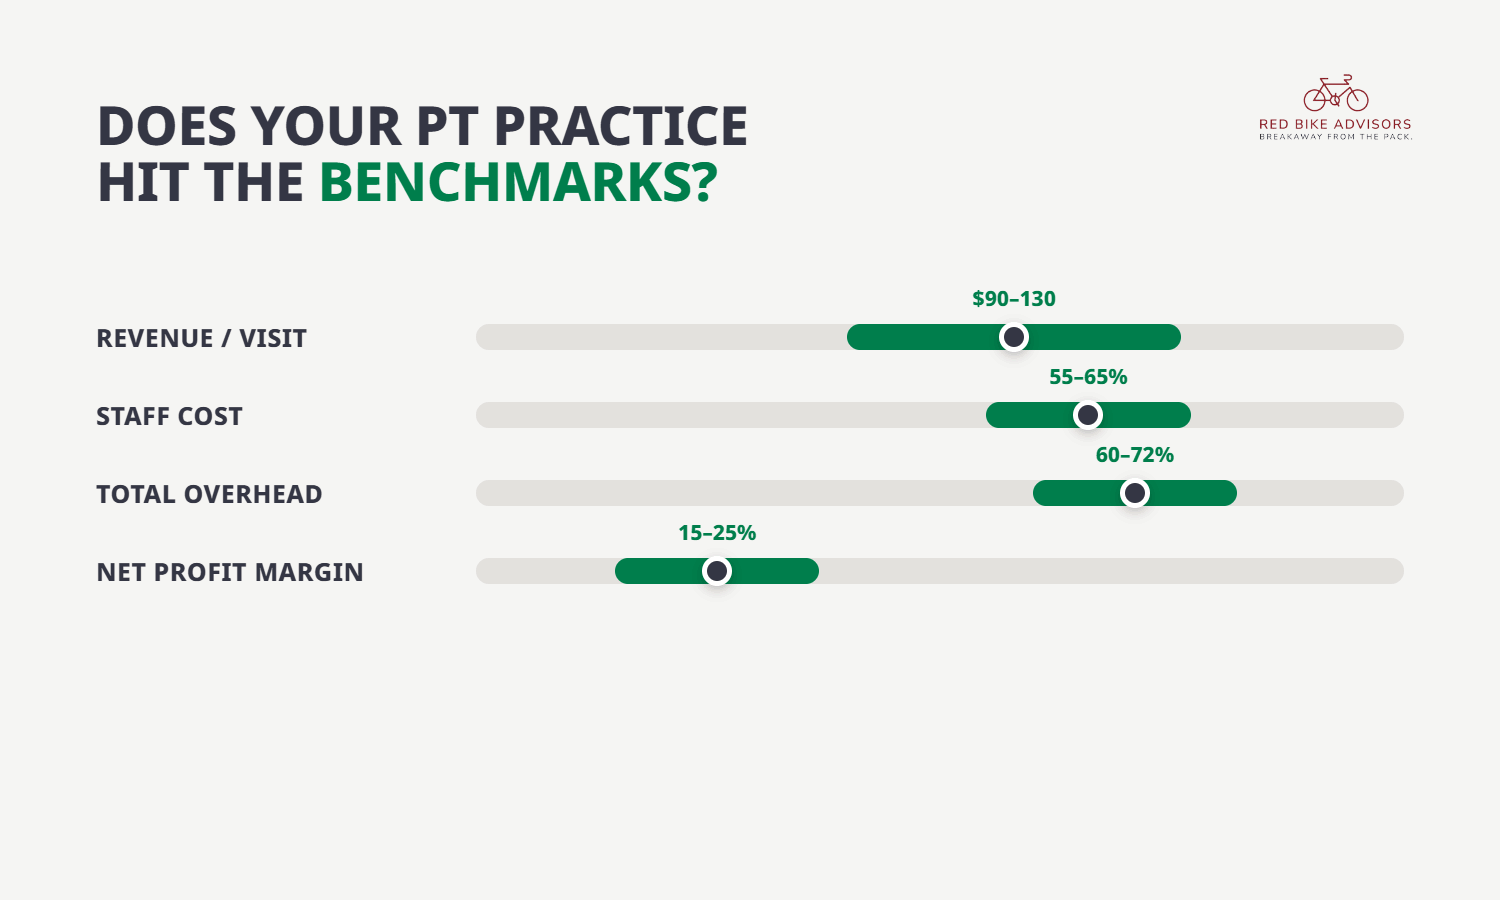
A healthy physical therapy practice at $500,000 to $2M in annual revenue typically runs total overhead between 60% and 72% of net patient revenue, with top performers closer to 62%. PT practices tend to have higher overhead ratios than some other healthcare specialties because of therapist compensation requirements and the labor-intensive nature of care delivery. The key metrics to watch are revenue per visit, staff cost as a percentage of net revenue, payer mix, and net profit margin. Here is what each of these should look like at your revenue level.
What is a healthy revenue per visit for a physical therapy practice?
Benchmark: $90 to $130 per visit for most outpatient general orthopedic PT practices (source: APTA and industry surveys; rates vary significantly by payer mix and geographic market)
Revenue per visit is the single most important driver of PT practice profitability because it directly reflects your payer mix and your billing efficiency. A practice seeing Medicare patients at $85 per visit and commercial insurance patients at $130 per visit has a dramatically different financial picture than one built primarily on workers' comp or cash-pay at $150 to $200 per visit.
If your revenue per visit is below $90, the first diagnostic questions are: What is your payer mix? Are you collecting everything you are authorized for? Are your billing units being maximized within the bounds of what is clinically appropriate and documented?
What should staff costs be as a percentage of net revenue for a PT practice?
Benchmark: 55% to 65% of net patient revenue for total staff compensation including therapist salaries, support staff, and payroll taxes.
This is the highest overhead category in almost every PT practice and the one that requires the most active management. Physical therapist compensation in the current market typically runs $65,000 to $95,000 per year for outpatient orthopedic clinicians depending on experience and geography (source: APTA salary survey). At those compensation levels, a single therapist needs to generate $200,000 to $300,000 in annual net revenue to be profitable.
If your staff costs are above 65%, the diagnostic questions are: Is every therapist meeting their productivity targets? Are patients being rescheduled and discharged at appropriate rates? Is administrative staff sized correctly relative to patient volume?
What is a healthy payer mix for a physical therapy practice?
Payer mix is the most significant structural driver of PT practice profitability, more so than in most other healthcare specialties because the reimbursement variance between payers is so large.
Highest margin: Workers' compensation, cash pay, and some commercial insurance plans at market rates
Mid-range: Most commercial insurance (Blue Cross, Aetna, Cigna, United) at negotiated rates
Lowest margin: Medicare and Medicaid, where reimbursement is lower and billing complexity is higher
A practice heavily dependent on Medicare can still be profitable, but it requires tight billing efficiency and therapist productivity to compensate for lower per-visit reimbursement. A practice with strong workers' comp or cash-pay volume can afford more operational flexibility.
What should net profit margin look like for a PT practice?
Benchmark: 15% to 25% of net patient revenue for an owner-operated practice where the owner is the primary or one of the primary treating therapists.
Net profit margin at the lower end of this range is common in practices that are growing rapidly, investing in new locations, or carrying high debt service. Practices with mature operations, stable referral sources, and low debt typically hit the higher end.
If your net margin is below 15%, the most likely culprits are staff costs above 65% of revenue, revenue per visit below benchmark for your payer mix, or overhead that has never been audited since the practice opened.
How does owner compensation affect the profit margin picture?
PT practice owners who are also the primary treating therapist face a measurement challenge: their compensation has two components. There is the market rate for their clinical work as a therapist (a cost of service), and there is the owner return on the business they built (the actual profit).
A PT practice showing 8% net margin may actually be quite profitable once you account for the fact that the owner is paying themselves $60,000 when the market rate for their clinical work is $85,000. Normalizing compensation to market rate before comparing against benchmarks gives you a truer picture of practice health.
Take the Physical Therapy KPI Benchmark Guide to see where your practice stands against industry standards: https://redbikeadvisors.com/book-a-free-strategy-session
Gretchen Roberts
Gretchen Roberts is CEO of Red Bike Advisors LLC. As a business owner herself, Gretchen has a deep understanding of the problems, questions, and financial pain points that business owners experience on a daily basis, and how strategic financial and tax planning is the key to "breakaway" business growth and success.