
What Is the Difference Between Production Per Visit and Collections Per Visit in a Dental Practice?

By Gretchen Roberts
Production per visit is the average value of services you performed per patient appointment. Collections per visit is how much of that value you actually received.
These are not the same number, and the difference between them is not a rounding error.
It is the most direct measure of revenue cycle performance in a dental practice.
A practice with strong production per visit but weak collections per visit is doing the clinical work and not getting paid for it. That is not a fee schedule problem or a volume problem. It is a billing and collections process problem.
What Is Collections Per Visit and How Does It Differ From Production Per Visit?
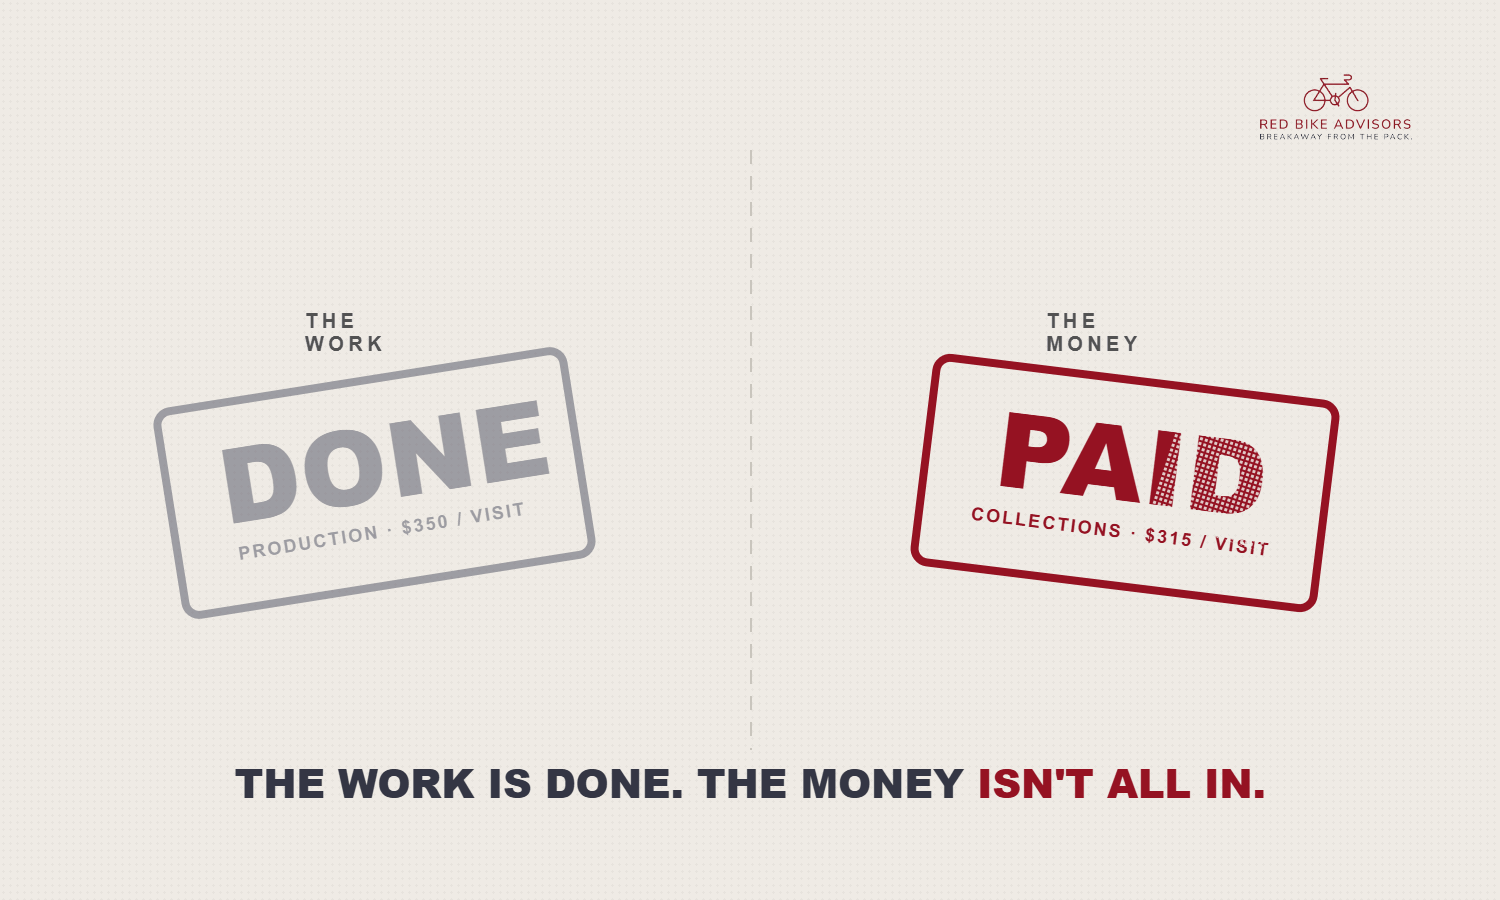
If your production per visit is $350 but your collections per visit is $315, you have a 10 percent gap. At 3,000 visits per year, that gap represents $105,000 in uncollected revenue annually.
The gap is almost always explained by three things: insurance adjustments above what is expected, uncollected patient balances, and denied claims that are never reworked.
None of those are clinical problems. All of them are fixable with the right systems.
What Is the Collections Rate Benchmark for a Dental Practice?
A healthy dental practice collects 98 percent or more of adjusted production. Top performers collect 99 percent.
At $1.5 million in adjusted production, the difference between 98 and 92 percent collections is $90,000. That is real revenue sitting uncollected in your billing system. It is not a fee schedule problem. It is not a volume problem. It is a billing process problem.
Improving your collections ratio from 92 percent to 97 percent generates $50,000 in additional revenue for a $1 million practice. Fixing those two problems would add $180,000 to annual revenue, without a single new patient!
What Drives Low Collections Per Visit?
Three patterns show up consistently in the practices I work with.
Patient balance collection treated as optional at the front desk. Copays and outstanding balances collected at check-in instead of being deferred to statements make an immediate difference. Every dollar chased after the appointment costs more to collect and collects at a lower rate.
Inconsistent or absent denial follow-up. Most practices have a denial rate they are aware of and a rework rate they are not. Denied claims that are never resubmitted are permanent write-offs. Top practices have a systematic denial follow-up workflow, not a best-effort one.
No one watching A/R aging past 60 days. Claims sitting beyond 60 days are at serious risk of never being collected. The older the claim, the lower the recovery rate. Practices that review aging weekly catch problems that monthly reviewers miss entirely.
What Does the Gap Between Production and Collections Look Like in a Real Practice?
I was in a strategy session recently with a dentist whose production per visit was healthy at $380. Collections per visit was $332. When we traced the 12.6 percent gap, almost all of it lived in two places: uncollected patient balances that the front desk was deferring to statements, and denied claims in one insurance category that had never been reworked.
Fixing those two problems would add $180,000 to annual revenue, without a single new patient!
The production was already there. The clinical work had already been done. The revenue was just sitting uncollected in a system no one was watching closely enough.
How Do Production Per Visit and Collections Per Visit Connect to Overall Practice Profitability?
Collections per visit is not just a billing metric. It directly affects every profitability benchmark on your P&L.
Staff costs as a percentage of collections go up when collections are lower than they should be, even if headcount has not changed. Overhead as a percentage of revenue rises for the same reason. Net profit compresses at the bottom because the revenue that should have arrived never did.
A healthy net profit margin for a dental practice is 37 to 41 percent of collections. Practices below 30 percent are often not spending too much. They are collecting too little.
Fixing the collections gap is typically faster and higher-impact than cutting expenses, because every dollar recovered goes straight to the bottom line.
How Do You Start Closing the Gap Between Production and Collections?
The starting point is knowing your numbers. Calculate your production per visit and your collections per visit separately. Find the gap as a percentage. Then trace where it lives.
Is it patient balances? Is it insurance adjustments? Is it aging claims past 60 days? The answer is almost always in one of those three places, and the fix starts with looking.
Want to benchmark your full set of dental KPIs? Take our Dental Practice KPI Benchmark assessment here.
Gretchen Roberts
Gretchen Roberts is CEO of Red Bike Advisors LLC. As a business owner herself, Gretchen has a deep understanding of the problems, questions, and financial pain points that business owners experience on a daily basis, and how strategic financial and tax planning is the key to "breakaway" business growth and success.